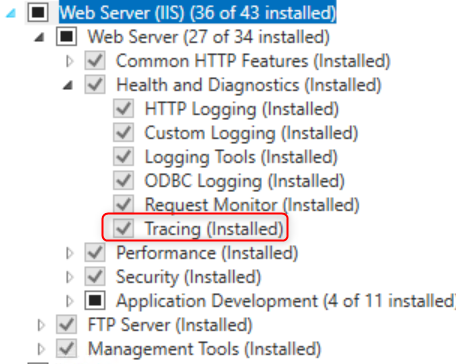
Make sure that the Tracing component of IIS is installed. You can find it under the following path: Web Server -> Health and Diagnostics -> Tracing.
Fork me on GitHub
IIS Failed Request Tracing Rules (FREB)
Prerequisites
Main steps
Press the
Win key + Ror right-click the Start menu and click on Run to open the Run dialog. Then, type inetmgr and press Enter to open the IIS Manager.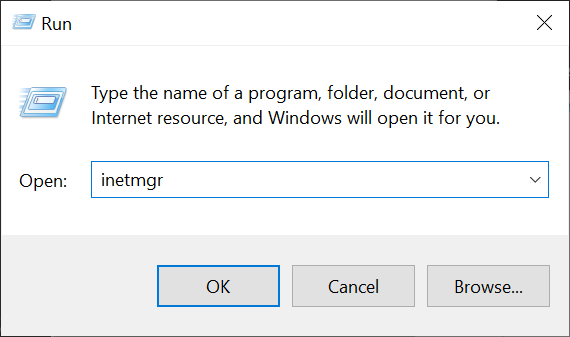
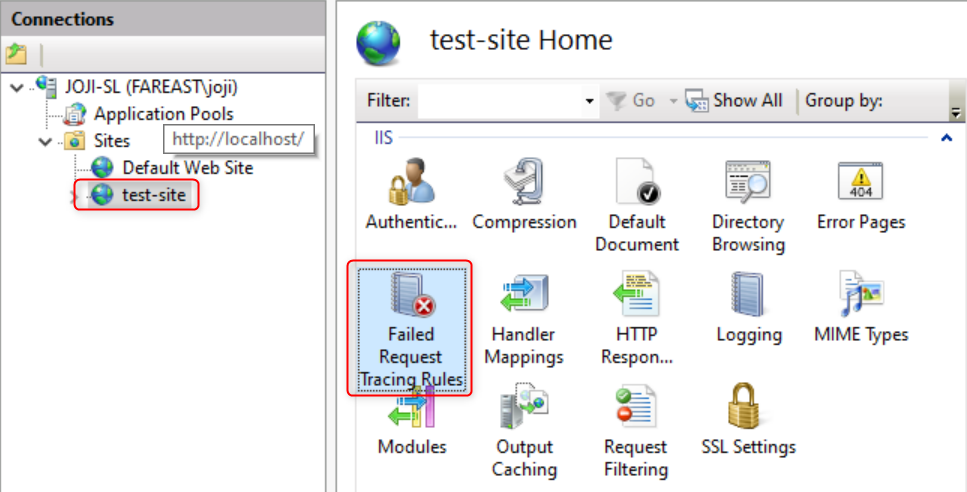
In the Connection panel on the right side, select the web site for which you want to enable Failed Request Tracing. Then, double-click on Failed Request Tracing Rules in the middle panel to access the settings page.
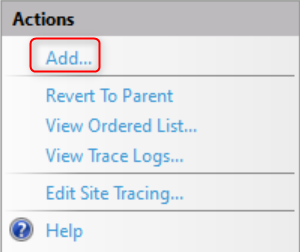
Click on Add in the Actions panel on the right side to add a new tracing rule.
Here, you can configure the tracing rule to target specific content:
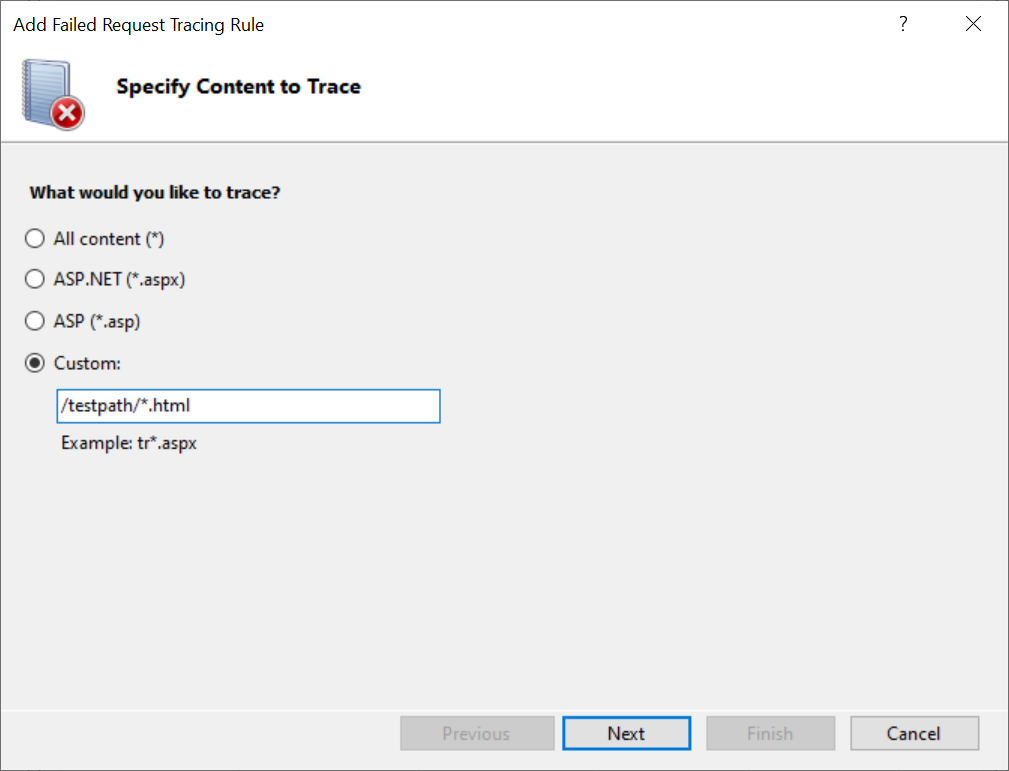
- Select "All content (*)" to trace all traffic for the site.
- Select "ASP.NET (*.aspx)" to trace requests for all *.aspx pages under the site.
- Select "ASP (*.asp)" to trace requests for all *.asp pages under the site.
- You can also input a custom URL pattern. For example, you can enter
/testpath/\*.htmlto trace requests for all HTML pages under the "testpath" path of the site, such ashttp://localhost/testpath/index.html.
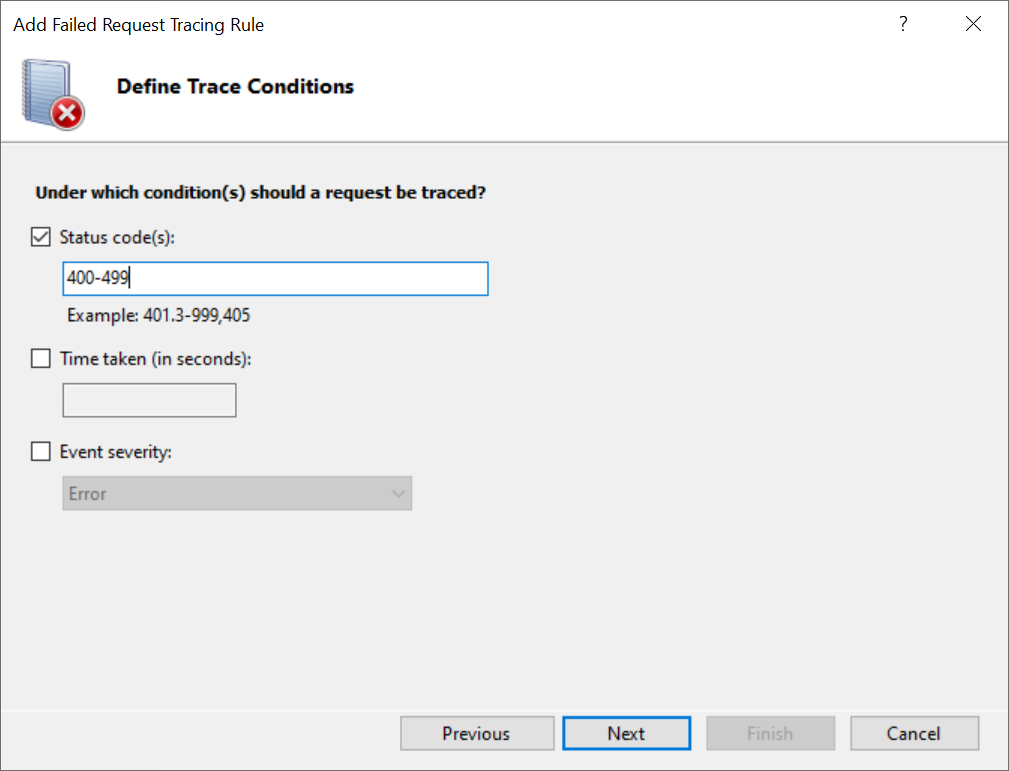
Next, you can choose the trigger conditions for the tracing rule. You can set it to trigger based on a specific status code or a range of status codes. Alternatively, you can set it to trigger when the HTTP response time taken exceeds a certain duration.
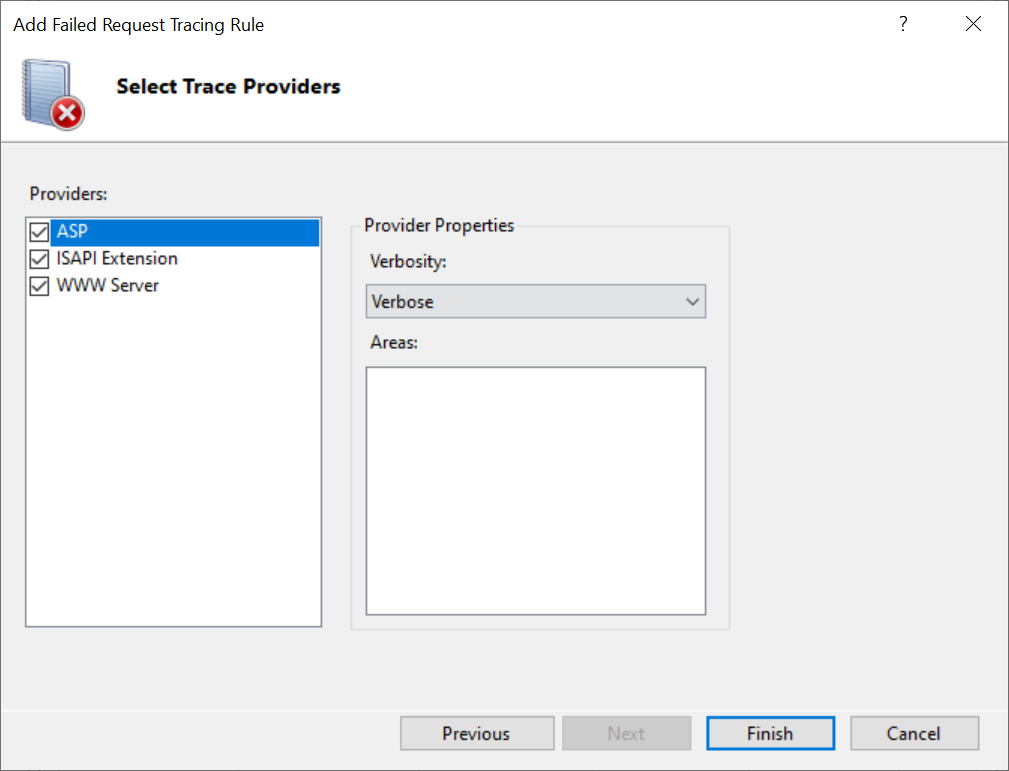
This page contains default settings to ensure that the tracing log includes sufficient diagnostic information. You can keep the default settings.
After clicking Finish, you will see the tracing rule added to the rule list. You can follow the above steps to add multiple tracing rules.
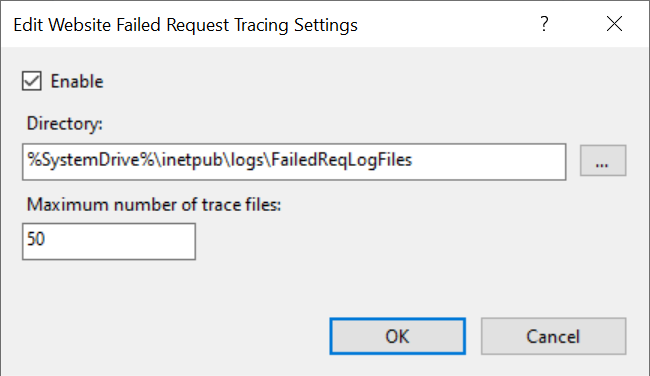
To enable Failed Request Tracing for the site, you need to click on Edit Site Tracing... in the Actions panel on the right side. Then, select Enable to activate all the configured tracing rules. Here, you can also choose the log file location for Failed Request Tracing. Remember this path for future reference when viewing the Failed Request Tracing logs. You can also set the maximum number of trace files, which is initially set to 50. This means that after exceeding 50 log files, the oldest log file will be deleted.
Next, please use a web browser or an HTTP client to access the relevant web site URL to trigger the tracing rules.
End steps
Press the
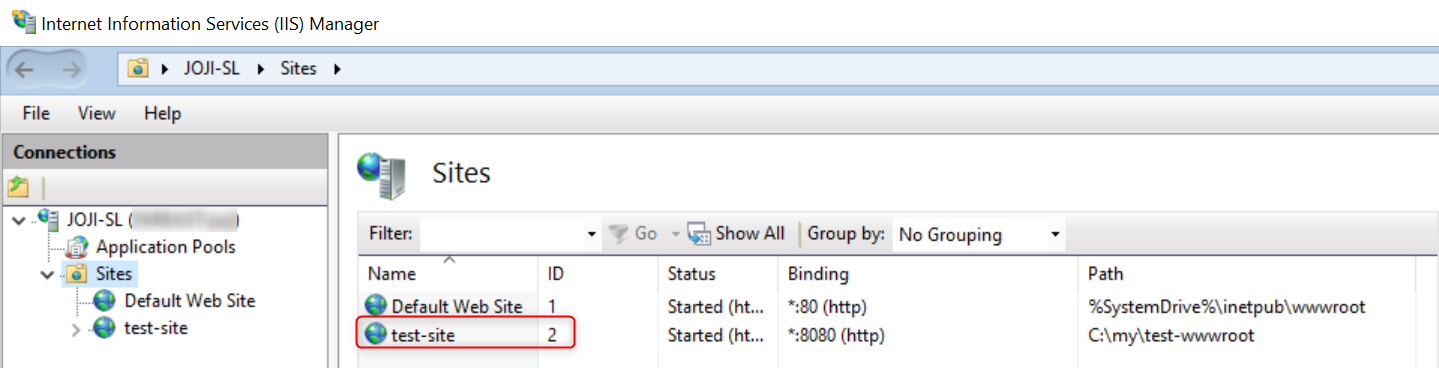
Win key + Ror right-click the Start menu and click on Run to open the Run dialog. Then, type inetmgr and press Enter to open the IIS Manager.In the left Connections panel, expand the server root node and select Sites. The middle panel will display all the IIS sites under that server node. Remember the ID of the target site from which you want to retrieve the IIS logs or Failed Request Tracing logs. Typically, the ID is represented by numbers such as 1, 2, 3...
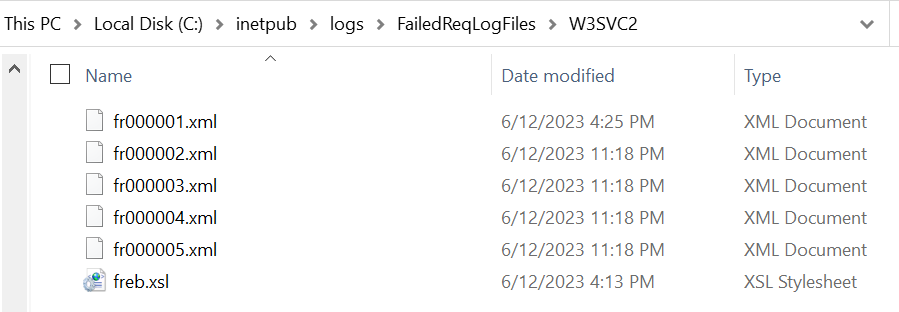
Open File Explorer and navigate to the path where Failed Request Tracing logs are stored. You may notice multiple folders starting with
W3SVCfollowed by a number. Select the folder that ends with the site ID you obtained earlier. For example, if the site ID is 2, choose the W3SVC2 directory. Once inside the directory, ensure that it contains the failed request tracing XML files and thefreb.xslfile. To obtain all the latest failed request tracing logs, compress the entire directory into a ZIP file.