Download from https://github.com/rajkumar-rangaraj/PDB-Downloader/releases/download/v1.0/PDBDownloader.exe and run PDBDownloader.exe.
Click on Open File(s), browse and select
iisw3adm.dllin the following directory, then click Start to begin downloading the Symbol files.- For 64-bit systems: C:\Windows\System32\inetsrv
- For 32-bit systems: C:\Windows\SysWOW64\inetsrv
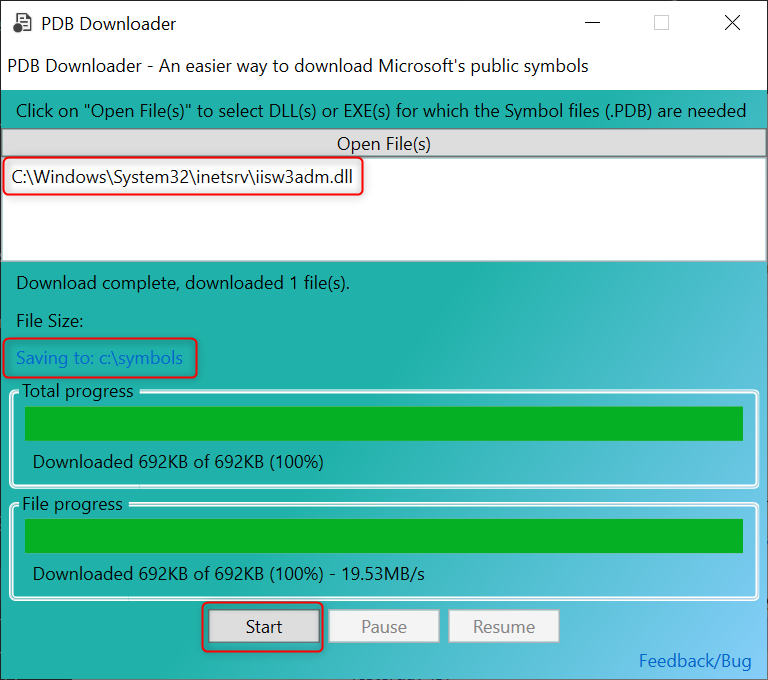
The downloaded Symbol files will be stored in
C:\symbols.Download and install the Debug Diagnostic Tool from https://www.microsoft.com/en-us/download/details.aspx?id=103453.
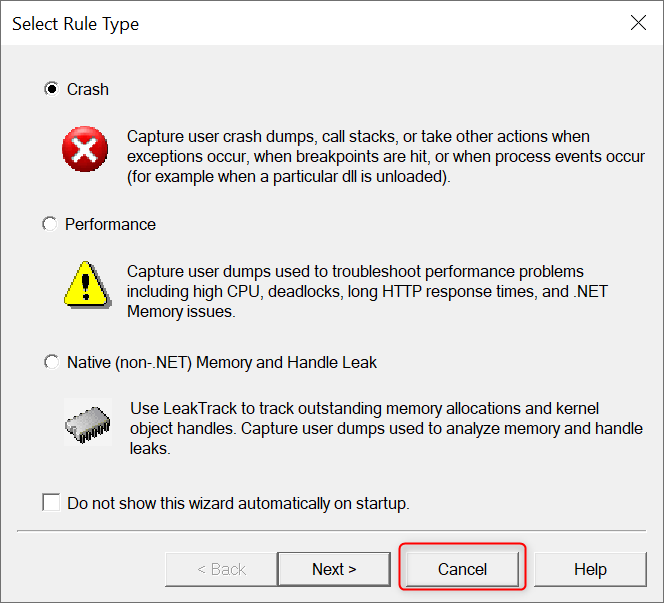
After installation, open DebugDiag 2 Collection. You will see a Select Rule Type window. Click Cancel to close this window.
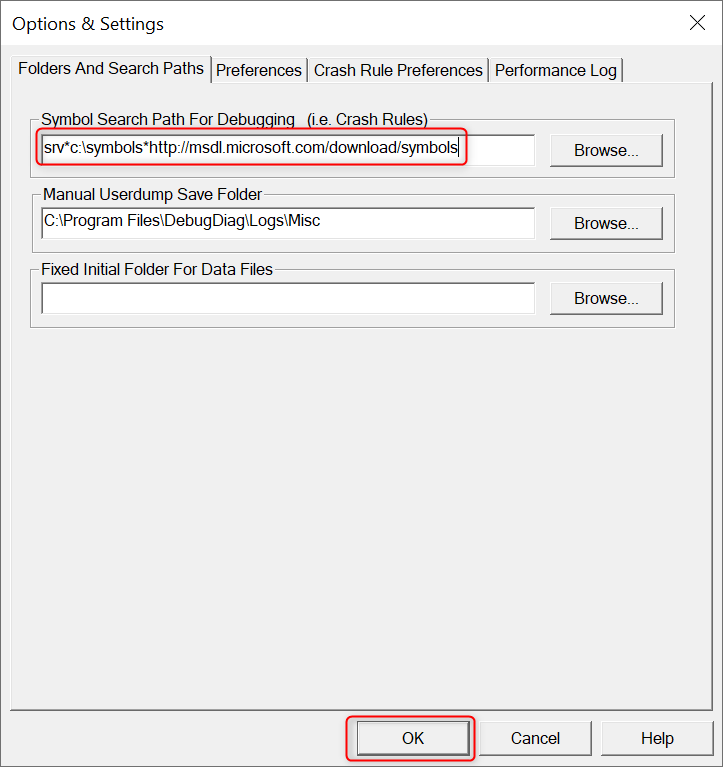
Open Tools -> Options And Settings..., change the Symbol Search Path to
srv*c:\symbols*http://msdl.microsoft.com/download/symbols, then click OK to save.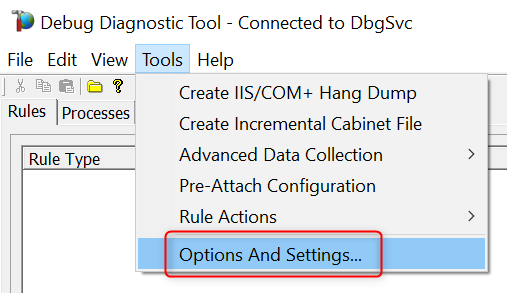
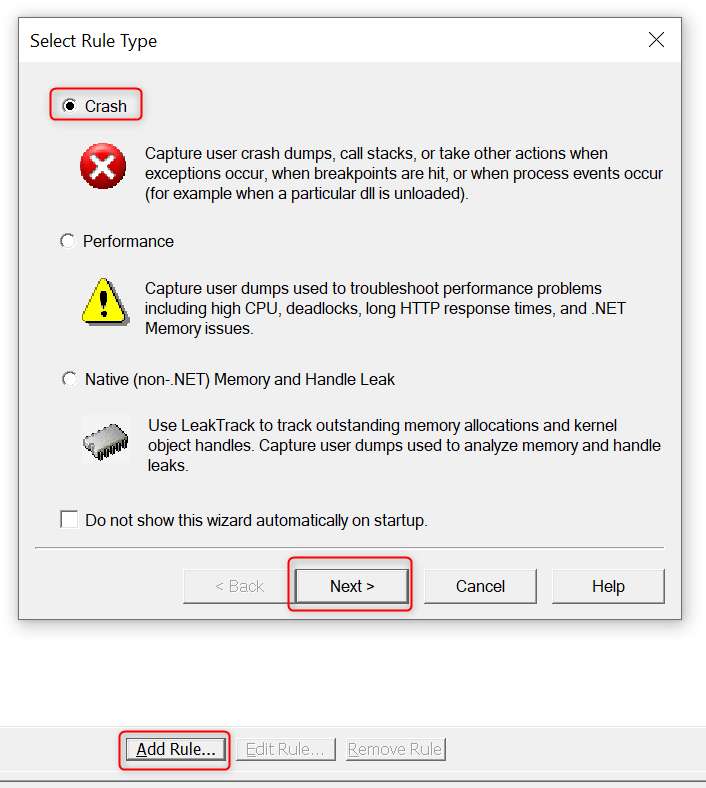
Click on Add Rule..., select Crash, then click Next.
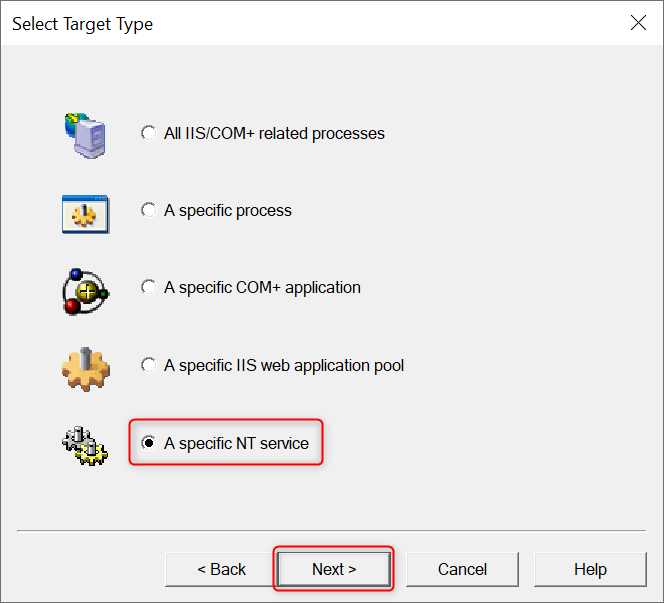
Choose A specific NT service as the Target Type, then click Next.
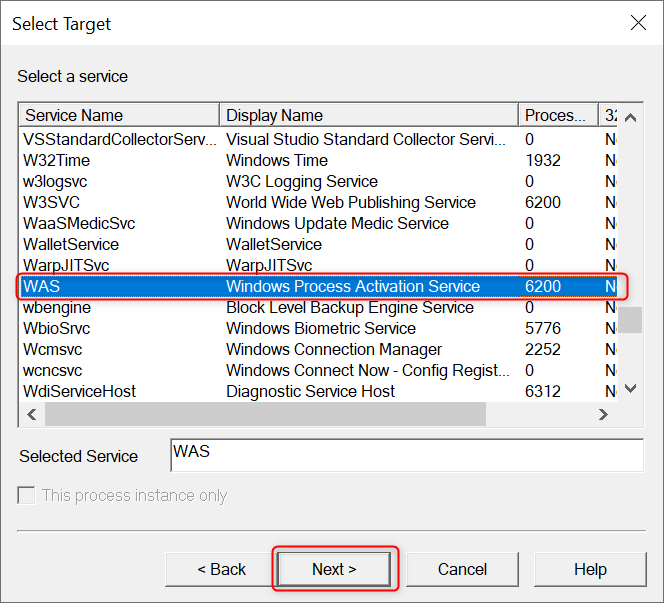
In the Select Target window, select WAS (Windows Process Activation Service), then click Next.
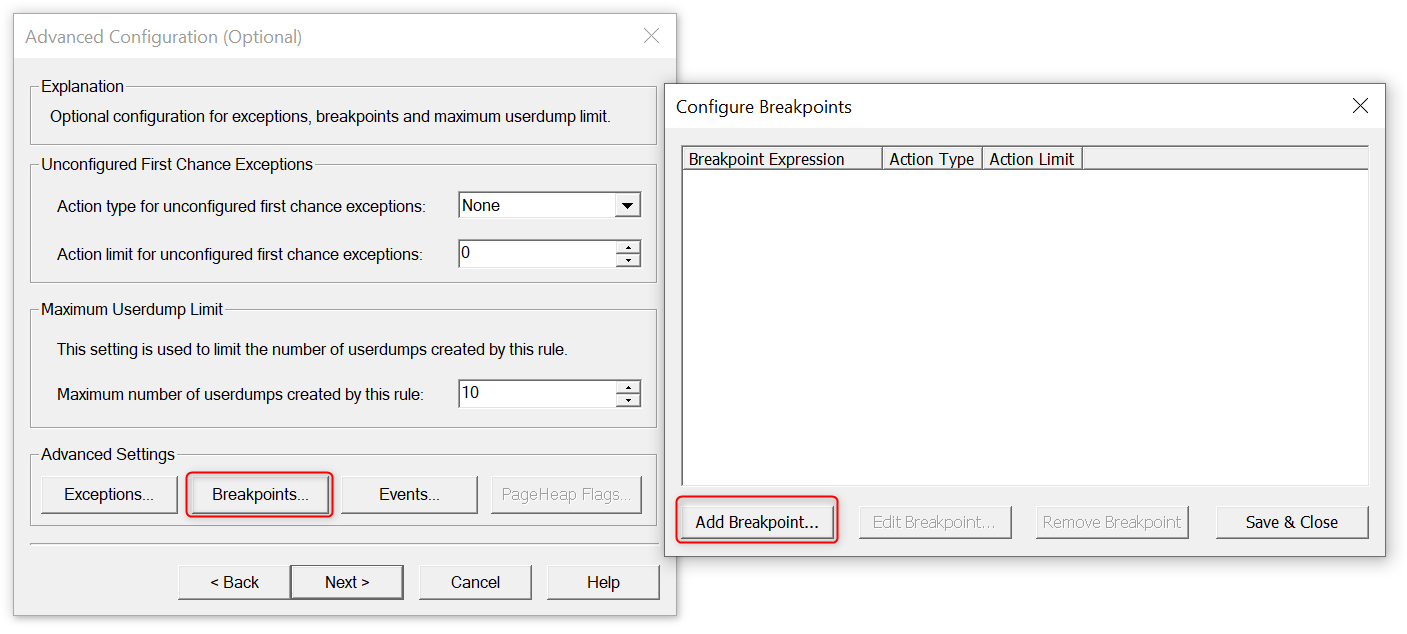
In the Advanced Configuration window, click on Breakpoints... to open the Configure Breakpoints window, then click on Add Breakpoint....
In the Configure Breakpoint window, enter
iisw3adm!WORKER_PROCESS::PingResponseTimerExpiredWorkItemin the Breakpoint Expression field, set Action Limit to 0, set Action Type to Custom..., a window for Provide DebugDiag Script Commands For Custom Action will pop up. Enter the following script content and click OK to save. Then click OK again to save this Breakpoint.Dim w3wpProcessId, rcx rcx = CausingThread.Register("rcx") w3wpProcessId = CInt(Debugger.ReadDWORD(rcx + 72)) WriteToLog "w3wp process id = " & w3wpProcessId Dim Controller, ActiveProcess Set Controller = CreateObject("DbgSvc.Controller") Set ActiveProcess = Controller.Processes.GetProcessByProcessID(w3wpProcessId) DumpName = ActiveProcess.CreateDump("PING_FAILURE") WriteToLog "Created dump file " & DumpName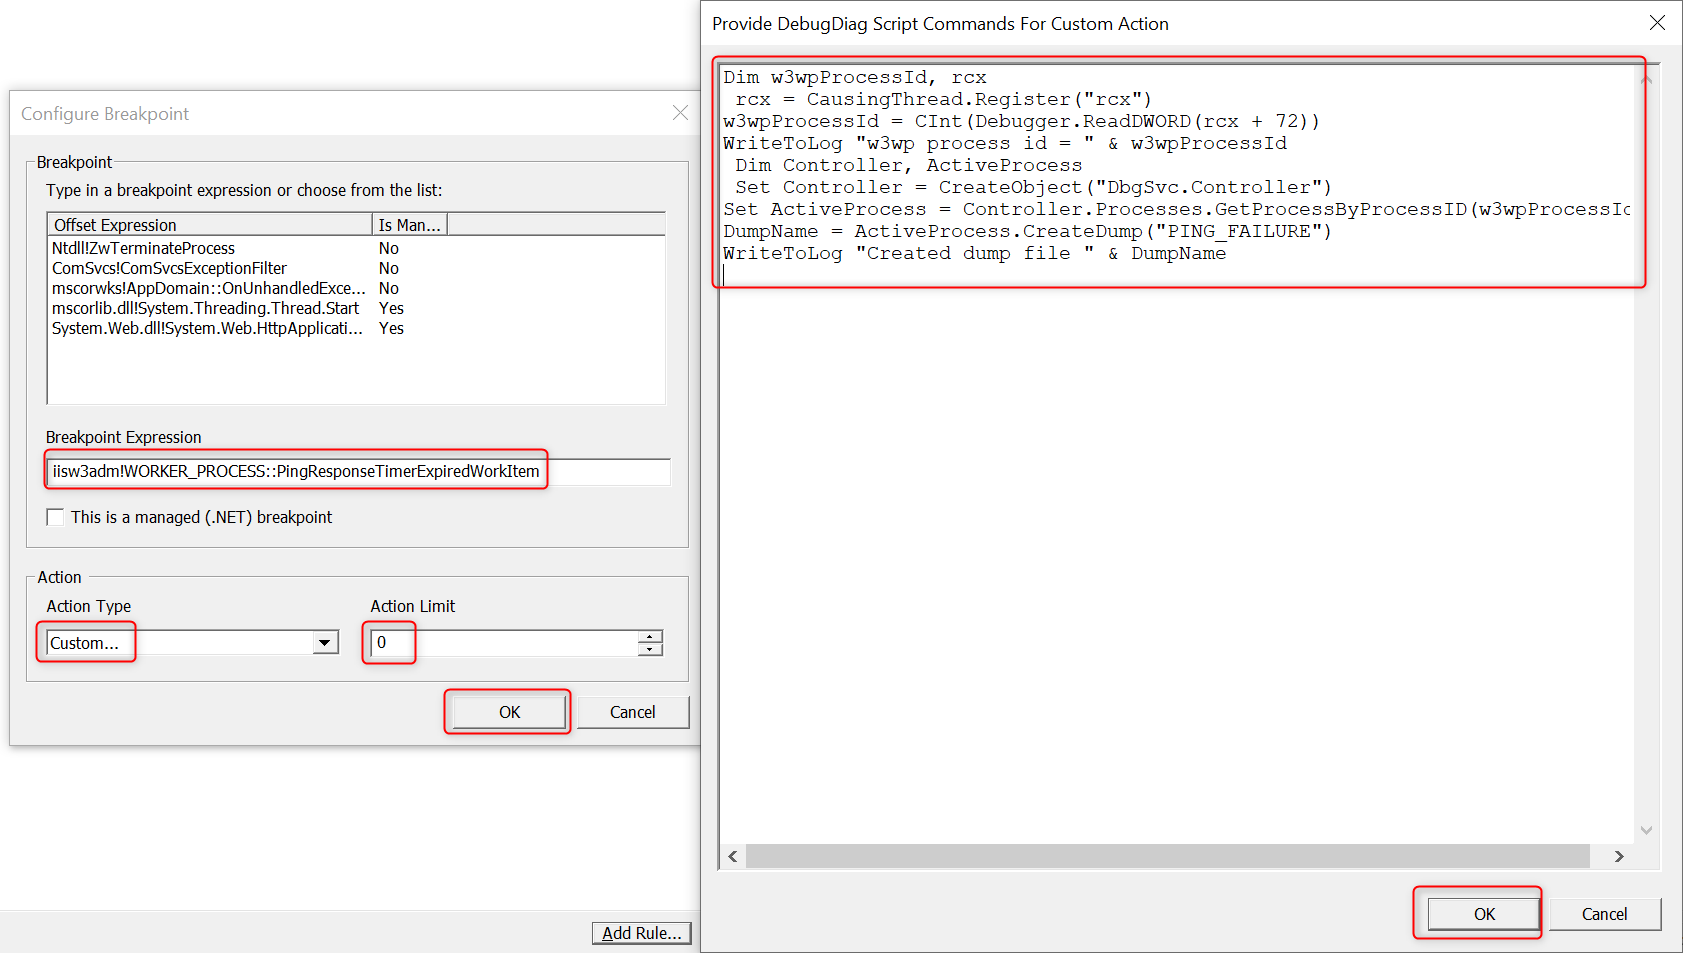
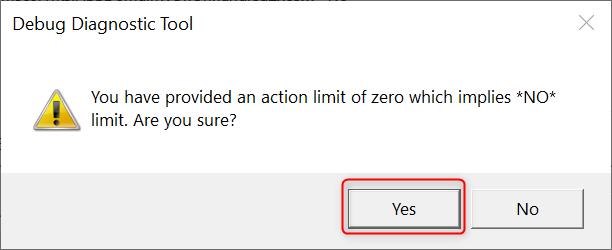
DebugDiag will show the following prompt, click Yes to continue.
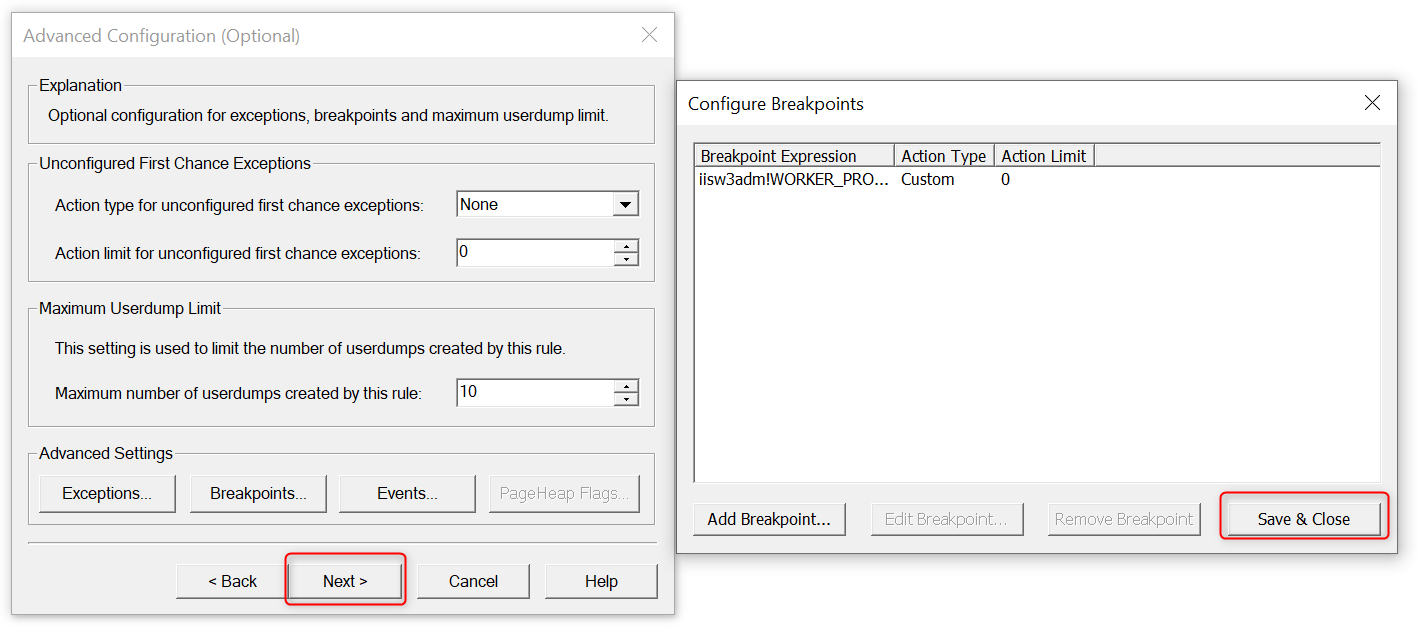
You will see the Breakpoint you just created in the Breakpoints list. Click Save & Close, click Next, then click Next again.
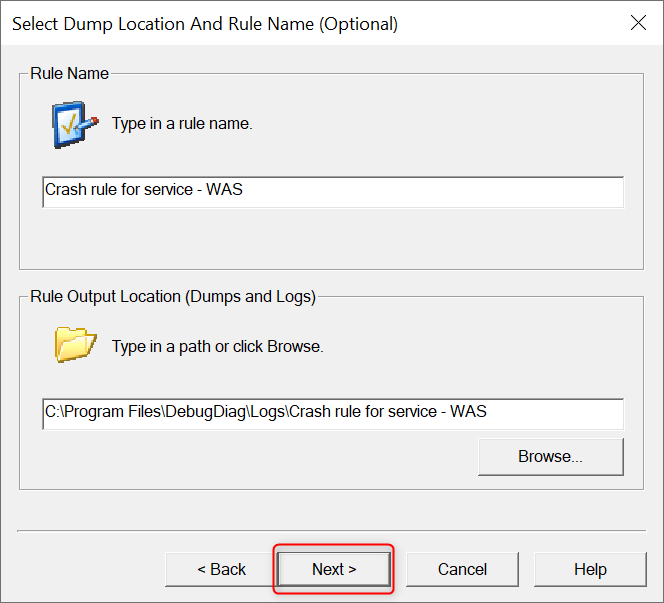
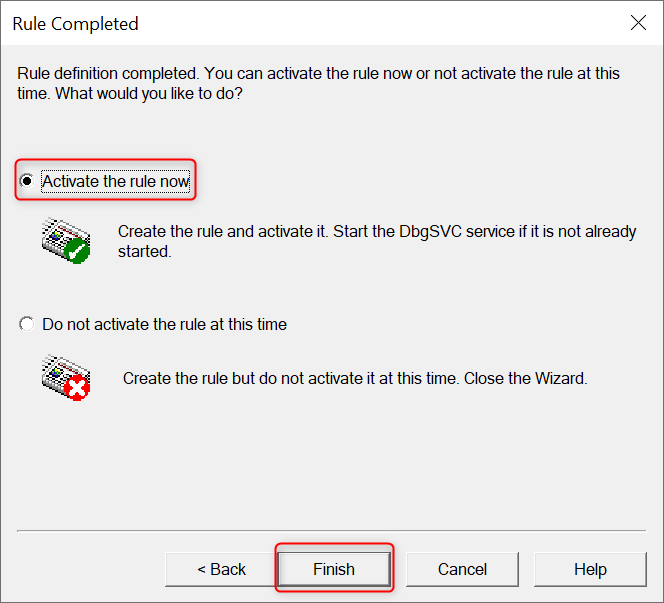
If you want this rule to take effect immediately, select Activate the rule now and then click Finish to complete the configuration.
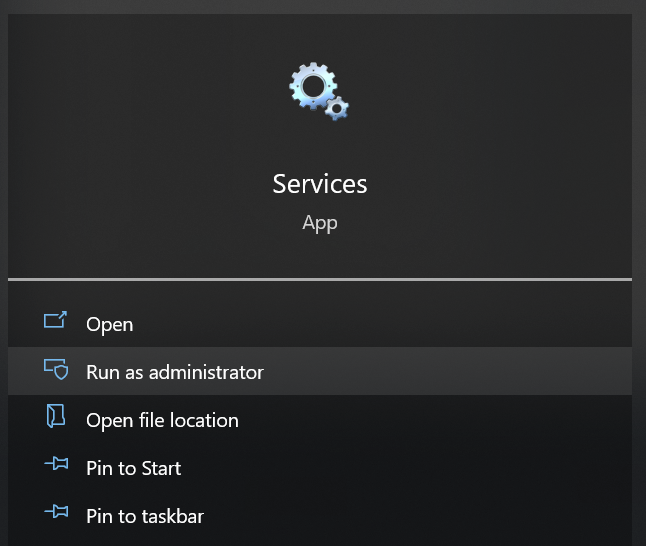
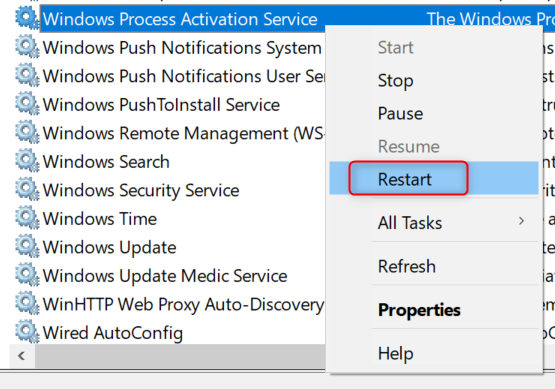
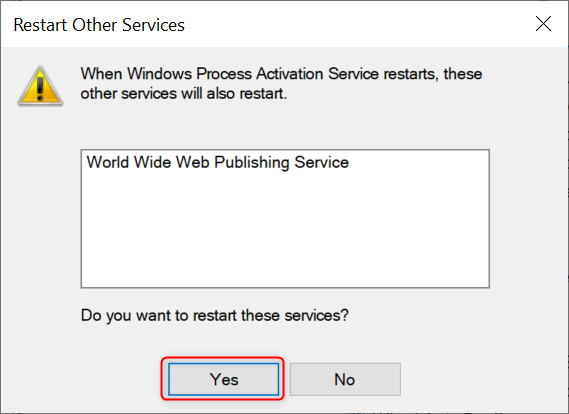
Open Services as an administrator, right-click on Windows Process Activation Service and select Restart. If a prompt asks you to confirm the restart of other associated services, click Yes to confirm.
You now have the rule configured. Let's just wait for the issue to reoccur. The dumps will be generated in the
Miscfolder atC:\Program Files\DebugDiag\Logs\Misc(no matter what folder you choose while creating the crash rule) and will have the textPING_FAILUREappended in the file name.
Fork me on GitHub
Capture IIS Application Pool (Worker Process) dump when it fails to respond to a ping using Debug Diagnostic Tool
Prerequisites
End steps
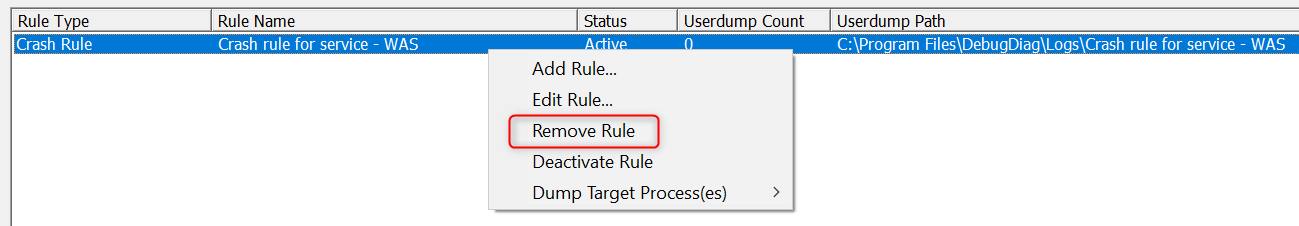
Once the issue where the IIS application pool fails to respond to a ping occurs, please go to
C:\Program Files\DebugDiag\Logs\Miscto retrieve the dump files captured by DebugDiag. Please stop the DebugDiag rule, as it will continue to capture memory dumps without a limit.