Download and install the Debug Diagnostic Tool from https://www.microsoft.com/en-us/download/details.aspx?id=103453.
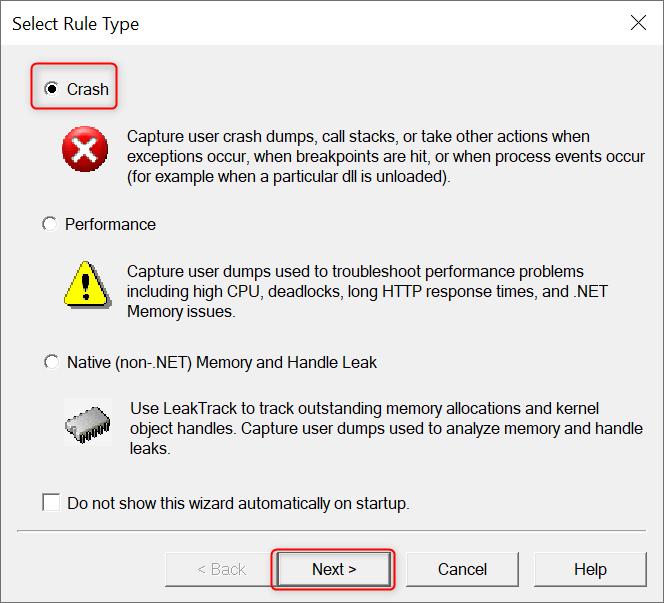
Once installed, open DebugDiag 2 Collection, select Crash as the Rule Type, then click Next.
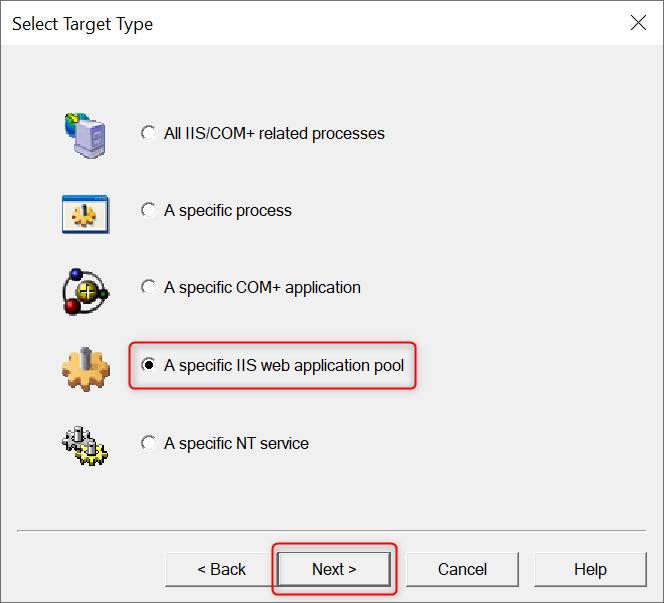
Choose A specific IIS web application pool as the Target Type, then click Next.
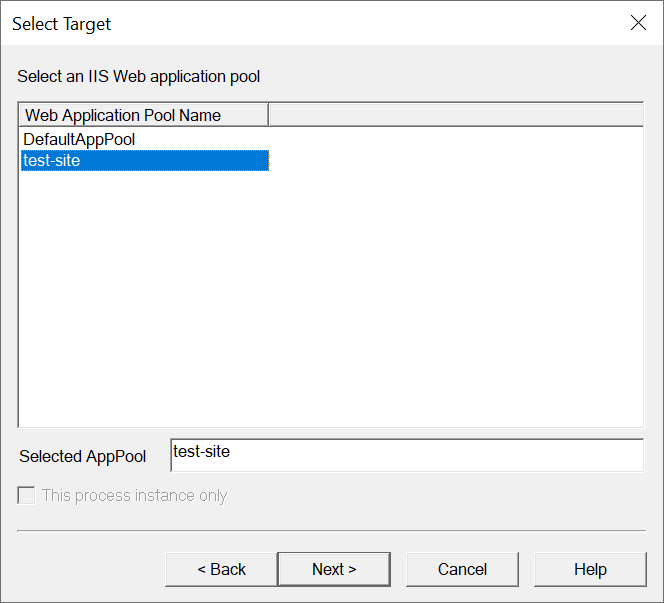
Select the IIS application pool from which you want to monitor exceptions, then click Next.
If you don't know the application pool corresponding to your IIS website, please refer to the steps below to retrieve it.
Press the
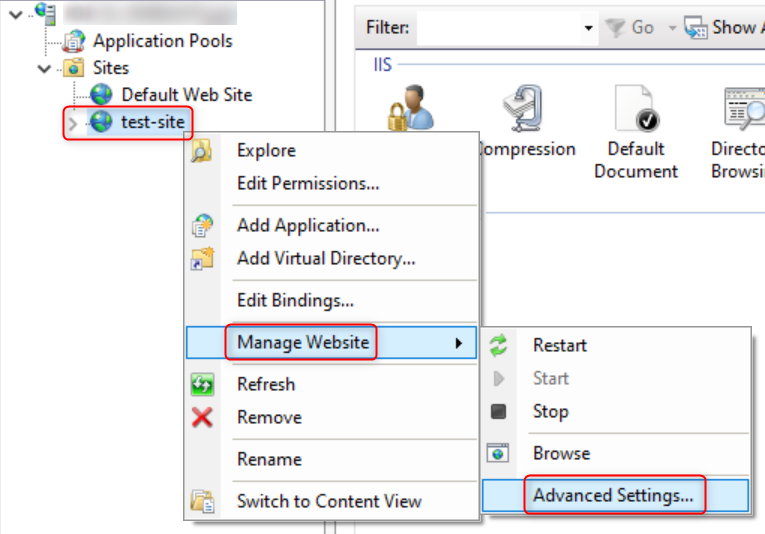
Win key + Ror right-click the Start menu and click on Run to open the Run dialog. Then, type inetmgr and press Enter to open the IIS Manager.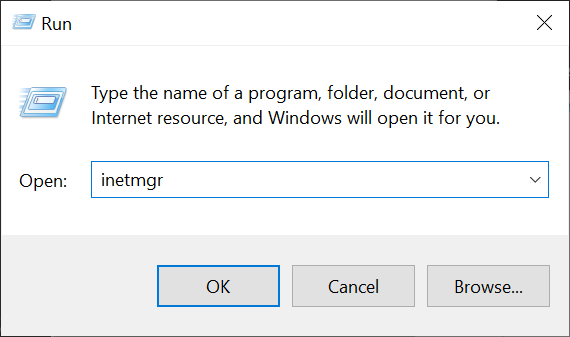
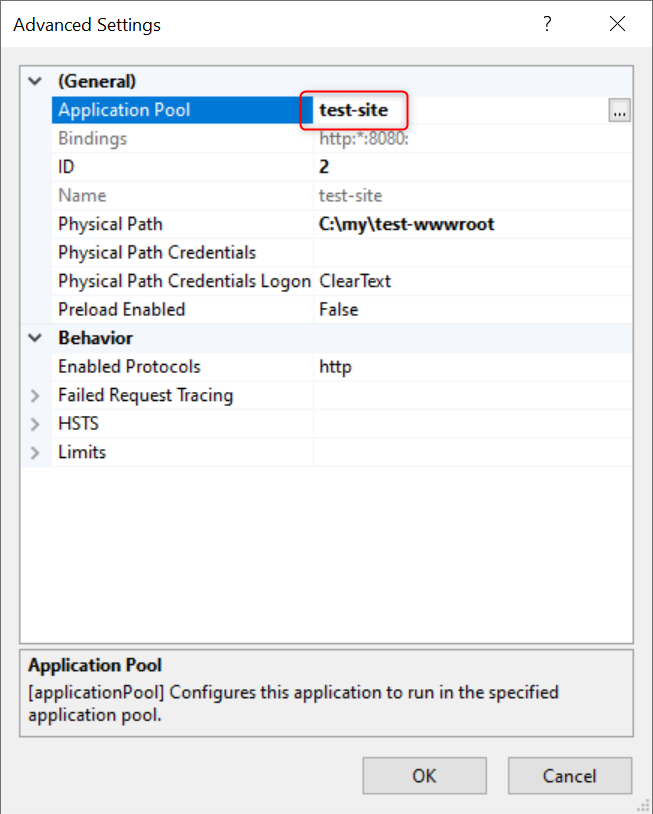
Right-click on the website for which you want to retrieve the Application Pool, then select Manage Website -> Advanced Settings.... In the Advanced Settings window that pops up, you will find the name of the Application Pool corresponding to the website.
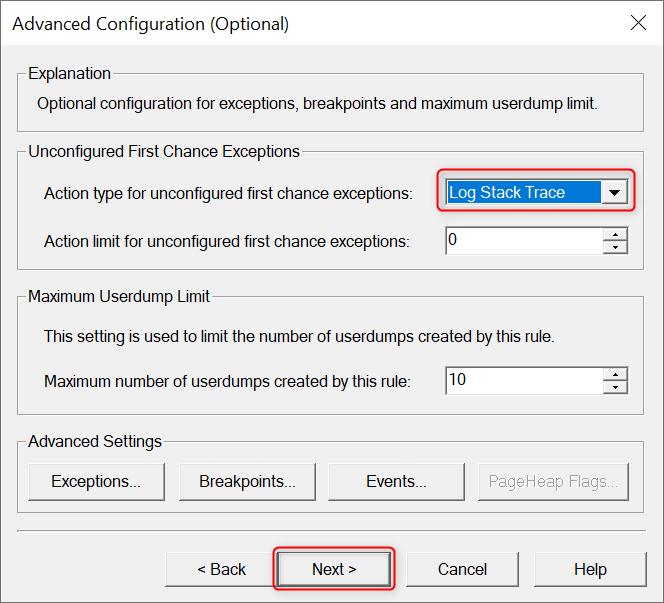
In the Advanced Configuration page, change Action type for unconfigured first chance exceptions to Log Stack Trace, keep all other settings as default, then click Next.
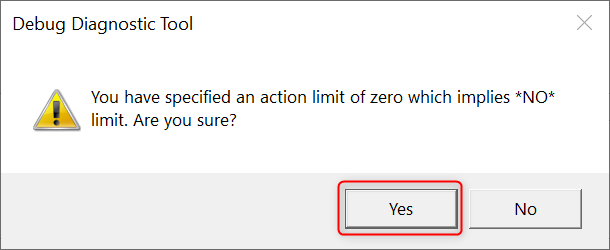
Click Yes if you see following prompt:
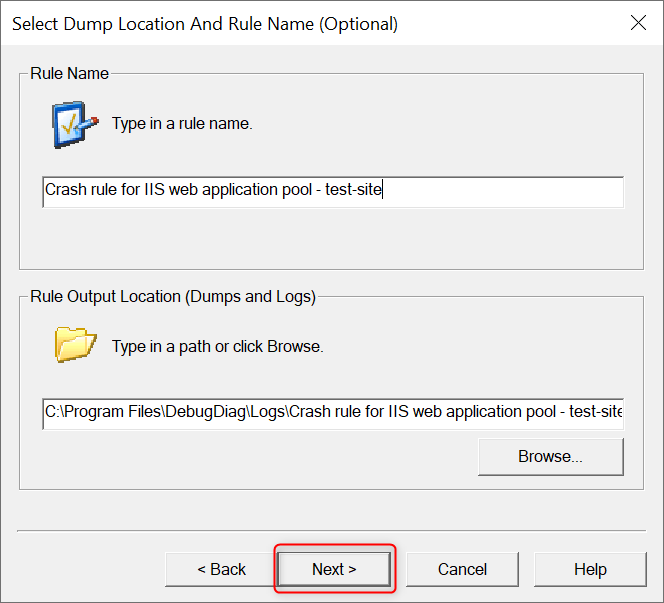
Keep default settings and click Next.
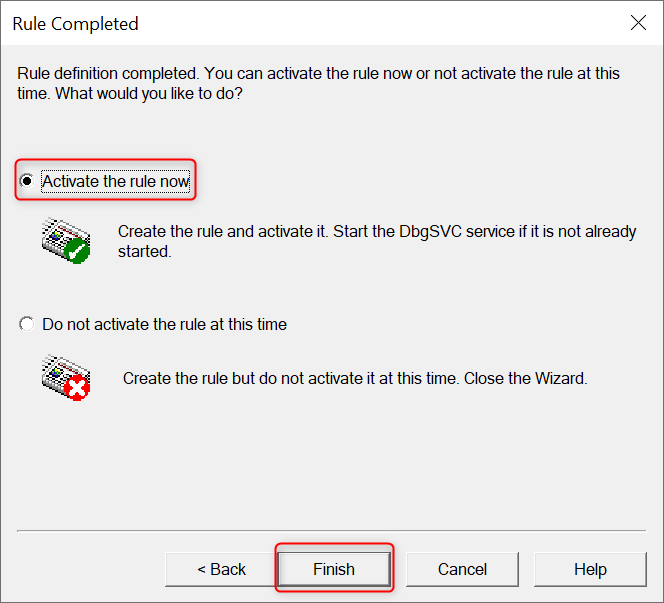
If you want the rule monitoring Application Pool exceptions to take effect immediately, select Activate the rule now and then click Finish.
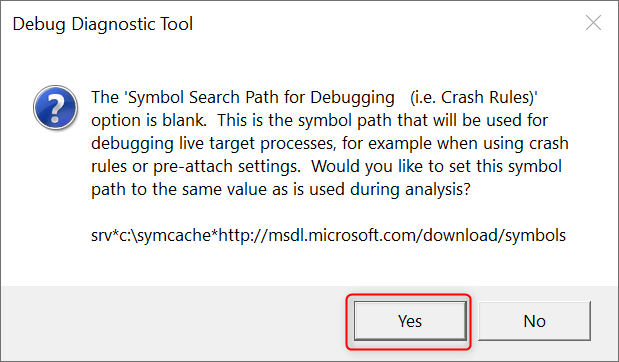
DebugDiag might display a confirmation box regarding the Symbol search path. Click Yes.
At this point, you should see the rule you just created in the Rules list, which means the configuration is complete. Next, let's monitor this Application Pool for a period of time. If the Application Pool throws any exceptions, DebugDiag will record the stack trace of these exceptions in plain text.